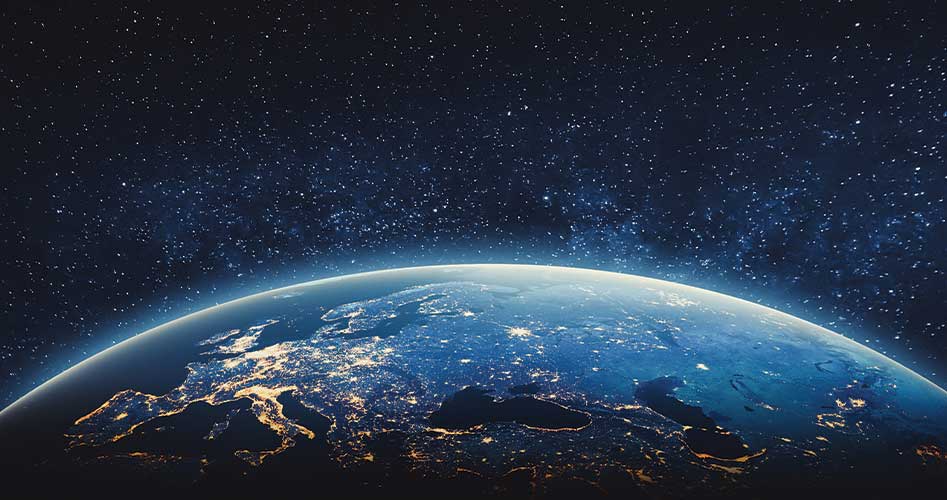
What Climate Change?
While international bureaucrats strive to strip us of reliable, affordable energy sources to combat a fabricated man-made climate catastrophe, they insist that we “Follow the science!” and demonize anyone who dares object.
Yet the truth is we don’t need scientists to tell us what is blatantly evident. We know the Earth has warmed over the past 175 years. And we know that the warming is well within the bounds of natural variation. All we need to do is look around.
The New American provides this photo essay of irrefutable evidence that there is no climate catastrophe in the making. And we ask a simple question: Whom are you going to believe, eco-radicals, or your own eyes?
A Warming World
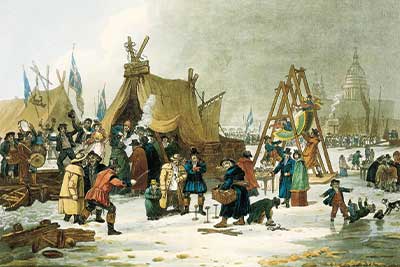
Do we live in a warming world? Let’s hope so! There are few who would wish a return of conditions as they were during the Little Ice Age (LIA), a period between roughly 1300 and 1850 when crop failures, famines, and epidemics held sway over Europe and Asia. As recently as 1814 the Thames could freeze hard and thick enough for Londoners to stage “Frost Fairs” on its icy surface. No one has tried that in modern days.
History records the thaw. In his book The Civil War Quadrennium, William O’Donnell tells the story of Union officers who sentenced a 17-year-old Confederate soldier to be hanged in January 1864. “Many hundreds of men, women and children trudged to the site from the north side of the Arkansas River, crossing on ice that had solidly covered the stream for several weeks.” Yet by 1912, although a frozen Arkansas River was uncommon enough to be featured on a postcard, people could again walk across. Another freeze occurred in 1983, but the ice at Little Rock was too thin to bear even a child’s weight.
Rivers Still Freeze
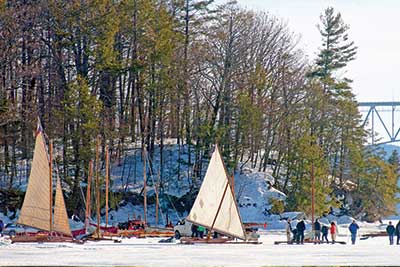
Some would call us lucky to be steadily emerging from the LIA since the late 1800s. But though conditions are notably improved, lakes and rivers still freeze in winter. Take Lake Pepin, formed by a swell of the Mississippi River between Wisconsin and Minnesota. In her autobiographical Little House on the Prairie, Laura Ingalls Wilder records her family’s trek across it in their covered wagon in 1868, as they were leaving the Badger State for Kansas.
Big River magazine calls Pepin “a hot spot for the oldest and coldest extreme sport on the Mississippi,” because iceboaters have been racing there each winter for more than a century. And it’s not the only place you’ll find the popular pastime — various ice-sailing associations compete in regattas throughout North America and Europe. In fact, the sport made its debut in the United States on New York’s Hudson River in 1790 and is still prevalent today.
It’s Been Warmer
The slow increase in temperature since the mid-19th century is actually a rebound from the LIA minimum, which stands in stark contrast to the prosperous Medieval Warm Period (MWP). Historians date the MWP from 900 until 1300 A.D., and a recent study by scientists at China’s Lanzhou University confirms that temperatures were 2.8 degrees Celsius higher than those of our day. Moreover, the preceding Roman Warm Period, nearly 2,000 years ago, experienced temperatures higher by nearly 2.9 degrees Celsius.
Receding glaciers help us tell this story. Eco-alarmists howl that their disappearance poses a harbinger of worse to come, and more than a decade ago the U.S. Geological Survey’s Northern Rocky Mountain Science Center warned that only 25 glaciers larger than 25 acres remained of some 150 that existed in 1910, when Glacier National Park was established. Interestingly, that’s the same number still reported in 2020, when park officials had to replace all of their signs that predicted a total melt by that year.
Perhaps the greatest tell is from the receding Schnidejoch Glacier on the Austrian-Italian border. Archeologists found the remains of Oetzi the Ice Man at an altitude of 3,000 meters (1.86 miles). He lived about 3300 B.C., during a warm period known as the Holocene Optimum. Ice preserved his leather clothing for thousands of years. Subsequent excavations also revealed weapons, household items, Roman coins, and other human remains. “Researchers were excited about the relics from a time when temperatures in the Swiss Alps were up to 2 degrees over today’s, the timber line had climbed substantially, and the glacial zone began roughly 700 meters higher than it does today,” reported the German newspaper Der Tagesspiegel in 2003.
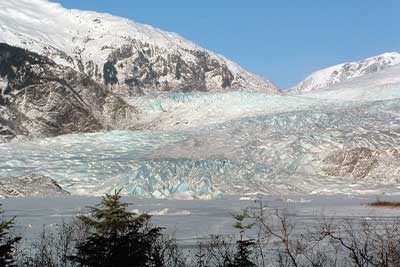
Meanwhile, the landscape beneath receding glaciers bears witness to a time when temperatures were much higher. “Ancient trees emerge from frozen forest ‘tomb’” reads a 2013 Juneau Empire headline. “The Mendenhall Glacier’s recession is unveiling the remains of ancient forests that have remained frozen beneath the ice for up to 2,350 years.” Archeologists are discovering the same in many areas — boreal forests far above the current natural tree line. Are the trees “climate deniers” too?
What of abandoned Viking settlements unearthed in Greenland beneath now-frozen tundra? In 1991, caribou hunters stumbled upon a 500-year-old farm along a riverbank in a now-uninhabited area. Excavators found the remains of trees there, too, though the region is today above the tree line. They hailed from a time when pioneers grew corn and barley in Greenland, now the world’s least densely populated country, which relies largely on food imports. Similarly, in 2015, excavators discovered a Viking outpost on Baffin Island, far north of the Arctic Circle, in a location that is currently desolate and barren.
Rising Seas, or Growing Skepticism?
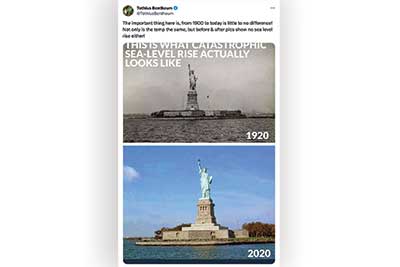
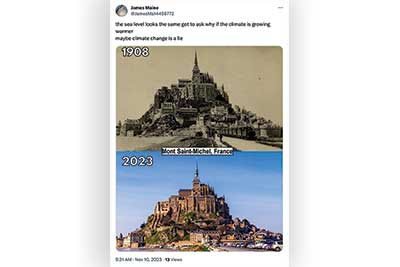
Despite alarmist claims that global-warming-provoked sea-level rise will erase vast swaths of land from our maps, we can look about and tell that just isn’t happening. However, before proceeding to our photographic evidence, it is important to note that sea level is affected by a vast array of variables, including tides, winds, currents, tectonic and seismic activity, erosion, and water temperature, to name just a few. Around the globe, sea level can “vary by up to 100 meters (328 feet),” according to the U.S. National Aeronautics and Space Administration.
In some cases, the sea remains level while the Earth moves. For example, a 2016 earthquake in New Zealand raised a portion of its eastern coastline by nearly five feet, as recorded by Victoria University. Prior to that extreme event, the area had been gradually sinking by a few millimeters each year, leading to an apparent — but not actual — rise in sea level.
Conversely, volcanoes can make land disappear entirely. Last year’s Hunga Tonga eruption all but erased that South Pacific island.
Regardless, many areas around the globe are worth pondering before we launch into sky-is-falling mode. Consider these “then and now” pictures:
The PSYOP
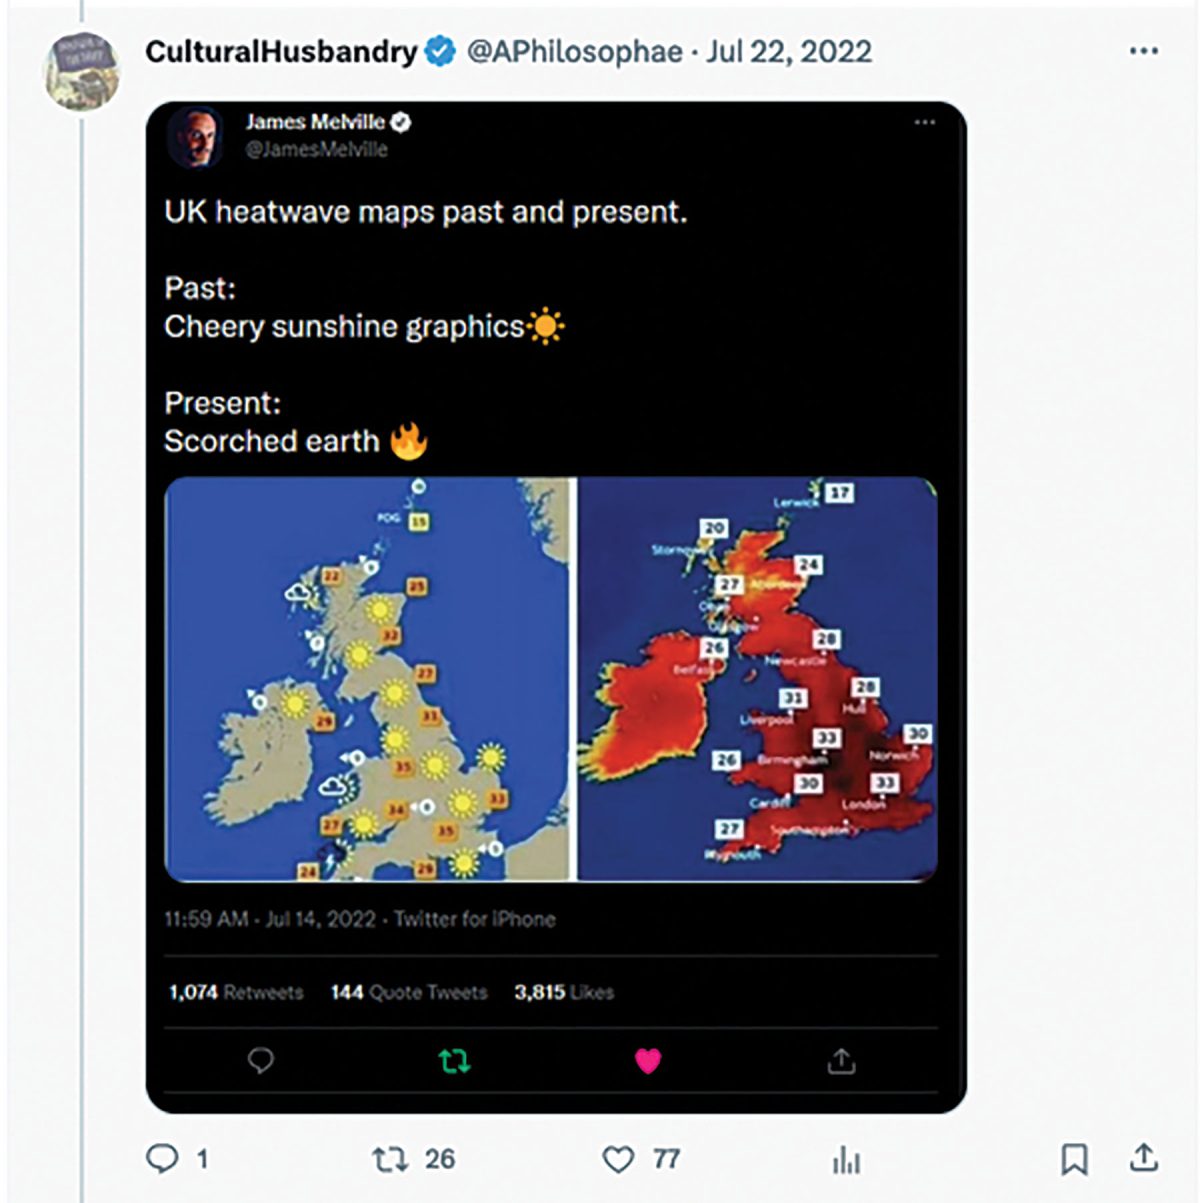
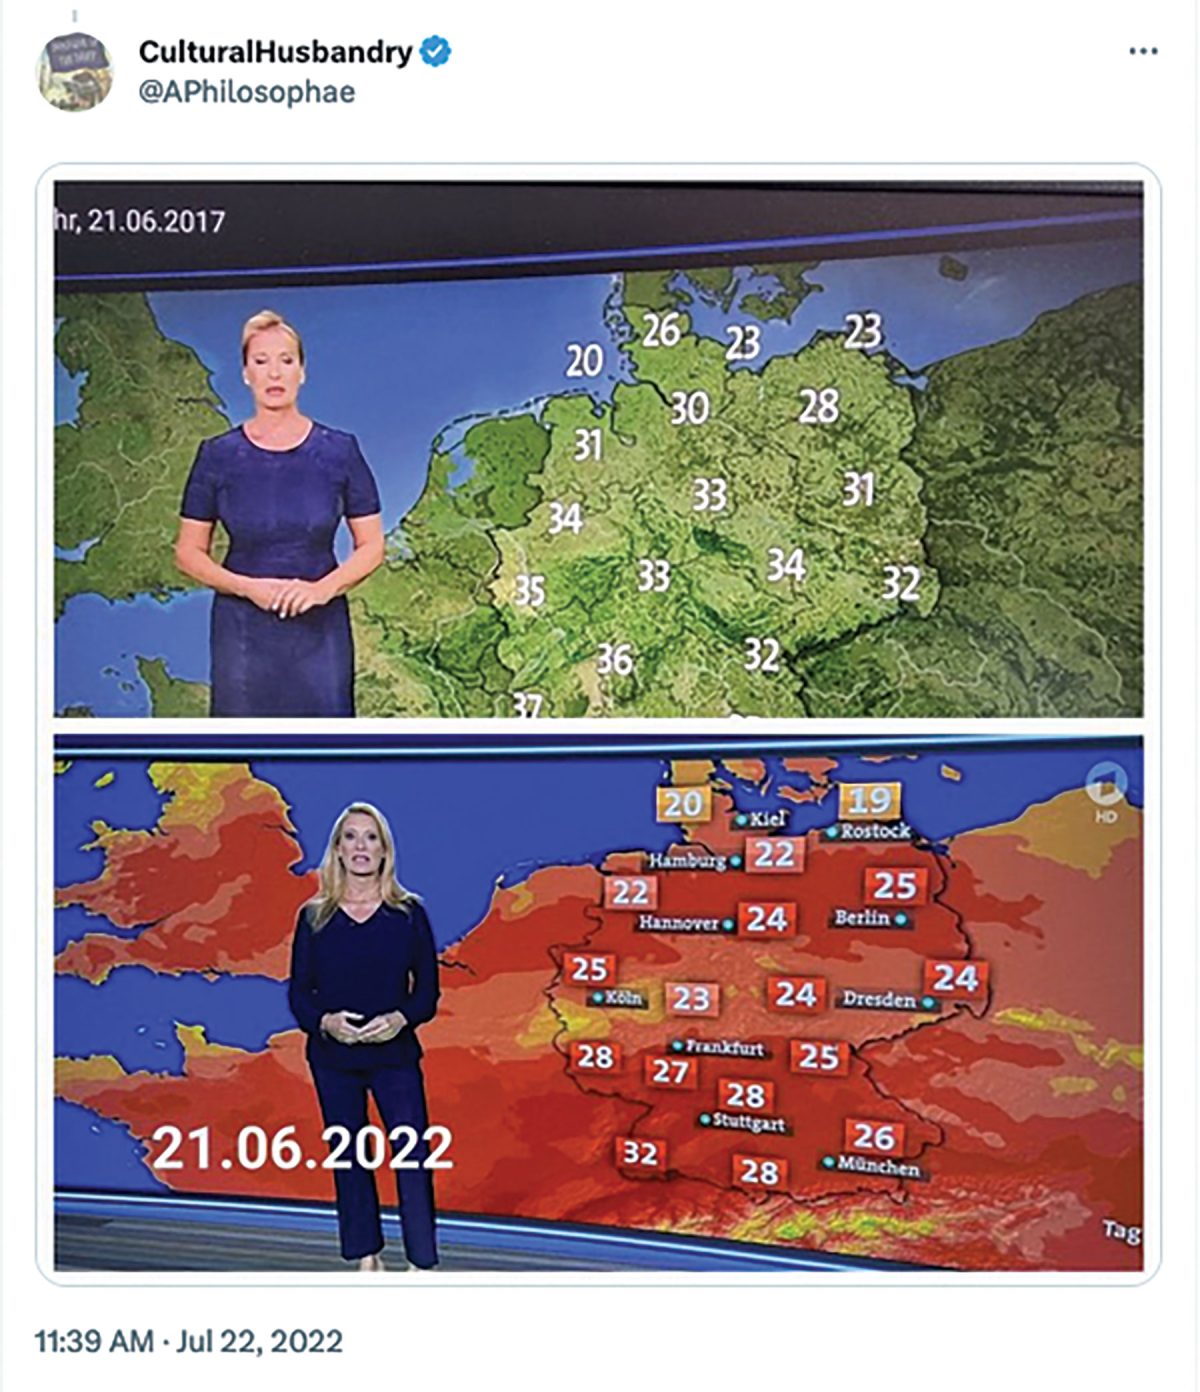
Nevertheless, eco-alarmists are bound and determined to make us think that by eating meat and driving SUVs, we are recklessly careening the globe toward fiery annihilation. Nowhere is the PSYOP more evident than in the updated color scales now used in temperature maps on the nightly news and in weather apps.
The first example below (of the U.K.) comes from Sweden. AFP Fact Check deemed “FALSE” the claim that these colors were changed to exaggerate global warming. It reported that “the first map was published in late July 2016 and the second in early August 2021,” and that the maps were produced “by separate Swedish media organizations.” Nothing to see here, of course.
Next, we go to Germany, where this time PolitiFact justified the new colors. It agreed that the maps are correctly labeled as being from 2017 and 2022. They are both from the same media outlet, and they both display expected high temperatures. However, the “red, orange and yellow heat map was part of a change in graphic format implemented in 2020,” PolitiFact explains, concluding that there is no deceit involved. And aren’t the emperor’s new clothes lovely, PolitiFact?
Conclusion
Limited space prevents us from including many more examples that could otherwise be added. Some emanate from historical records, others from archaeological evidence, and a vast array from plain, old-fashioned common sense.
After all, science is still catching up with history, for there was no reliable temperature measurement system before 1714 when Daniel Fahrenheit invented the first mercury-in-glass thermometer, and that did not come into general use until the late 1800s. For the next 100 years there was no uniform monitoring of the temperature of the Earth’s surface or the oceans. By 2000, only 50 percent of the globe had thermometer coverage.
So, how can we possibly know that current temperature trends are well within the bounds of natural variation? Just ask your own eyes!


