Immediately below is the graph that Beck featured on his January 29 show. It was blown up into a huge graph on the set. Beck provided a walking tour of the graph (video here) complete with historical highlights ranging from the Stock Market Crash in 1929 to the huge Federal Bailouts that began in late 2008. When Beck reached the end of the graph (December 2008), the endpoint burst into flames to help make his point that something extraordinarily bad was happening with our money supply.

Here’s what Beck said about this graph at the end of his tour:
“Look at this hockey stick…. Here’s where we were in September last year, but then the Treasury decided we need to start printing more money. This hockey stick should take your breath away. This is devaluing our money…. We have pumped all this money in and devalued our money. How is it not going to be worthless? This has never ever been done by anybody ever before.” (Glenn Beck, Glenn Beck TV Show, January 29, 2009)
This is very dramatic stuff. Since Congressman Ron Paul, Austrian economists, the John Birch Society and others have been warning Americans for years about the losses in buying power of the dollar owing to the Federal Reserve’s creation of money out of thin air, and have created the expectation that we could enter an era of rapid or even hyperinflation sometime soon, it’s not surprising that Glenn Beck and many others are especially on the lookout for signs that the Fed is on the verge of inflicting rampant inflation on Americans. And, of course, the ongoing multiple-trillion-dollar bailouts that are occurring make the rapid inflation scenario even more plausible.
Thus, the graph of our nation’s monetary base (above) with its sudden hockey stick shape appears to provide a "smoking gun" to prove the Fed has begun a new phase of rapid inflation of the money supply, which would mean a new phase of rapidly increasing prices for everything. As Beck says, "We have pumped all this money in and devalued our money. How is it not going to be worthless?" In fact, Beck has been strongly urging his viewers to share the video clip from his show about the hockey stick chart with everybody they know.
So an obvious question is: does the Fed’s hockey stick chart of the monetary base actually reflect a sudden, huge increase in the money supply engineered by the Fed, which would mean we’re in for an increased rate of loss in the buying power of the dollar? Which is to say: Is Glenn Beck’s alarm over this chart justified?
Before answering this question, let’s take a closer look at the role of the "monetary base" in Federal Reserve monetary policy. Back in August 2006, Richard G. Anderson, Vice-President of the Federal Reserve Bank of St. Louis, wrote a working paper entitled, "Monetary Base," which is currently posted online by the Research Division of the Federal Reserve Bank of St. Louis at http://research.stlouisfed.org/wp/2006/2006-049.pdf. Although the working paper carries a boilerplate disclaimer stating: "The views expressed are those of the individual authors and do not necessarily reflect official positions of the Federal Reserve Bank of St. Louis, the Federal Reserve System, or the Board of Governors," it is highly interesting to read what this paper has to say regarding the monetary base.
Here is an extended excerpt from Anderson’s "Monetary Base" paper:
The monetary base in monetary economics is defined and measured as the sum of currency in circulation outside a nation’s central bank and its Treasury, plus deposits held by deposit-taking financial institutions (hereafter referred to generically as “banks”) at the central bank….
In monetary economics, the monetary base has several unique characteristics. First, its components include the assets issued directly by a nation’s monetary authorities (Treasury and central bank) that are used by the private sector (the public and banks) to settle transactions…. Second, the size of the monetary base changes only if the monetary authorities take actions, actively or passively, to permit the change…. Hence in monetary theory the monetary base, under the control of the monetary authorities, is the direct link between monetary policy actions and economic activity, including subsequent inflation….
Central banks control the supply of the monetary base by buying and selling assets. Purchases of assets, of any type, increase the monetary base when the central bank pays for such assets with currency or increased central bank deposit liabilities. Similarly, central bank sales of assets, of any type, reduce the monetary base when the purchaser surrenders currency or central bank deposit liabilities in payment. So long as the public willingly holds additional base money, the central bank is able to purchase assets and expand its size. Historically, this has tempted governments with weak fiscal discipline to utilize the central bank as a purchaser-of-last-resort for government debt when private capital markets are unreceptive, often leading to hyper-inflation….
Many empirical studies have examined linkages among growth of the monetary base, growth of broader monetary aggregates, and an economy’s inflation rate. Over long periods of time, there is a clear positive relationship: absent significant structural or regulatory changes, prolonged inflation (and, especially hyperinflation) cannot continue without increases in the monetary base. In most historical cases, excessive growth of the monetary base has reflected lack of fiscal discipline, not failure of monetary policy…. (emphasis added)
Especially interesting for our present purpose are the portions of the above quote that have been emphasized by bold type. For example, Anderson stated: "Hence in monetary theory the monetary base, under the control of the monetary authorities, is the direct link between monetary policy actions and economic activity, including subsequent inflation…." This statement serves to reinforce the importance of the current hockey stick shape of the Federal Reserve’s monetary base chart.
Another very important statement by Anderson concerns how historically, governments with weak fiscal discipline are tempted to utilize the central bank as a "purchaser-of-last-resort for government debt … often leading to hyper-inflation." We certainly have a government with weak fiscal discipline and even the New York Times acknowledges that the Federal Reserve is prepared to print whatever money is required to get our nation out of our current economic crisis. Anderson even mentions the h-word, hyperinflation.
One last gem from the above extended excerpt is the statement that many empirical studies have shown a clear positive relationship between growth of the monetary base, growth of broader monetary aggregates (presumably M1 and M2), and an economy’s inflation rate (referring to the popular notion of inflation as consisting of rising prices).
Thus, Anderson’s commentary in the extended excerpt above about the role of the monetary base in our economy certainly highlights just how significant the hockey stick portion of the monetary base chart is. Based just on Anderson’s paper, we already have enough information to say that Glenn Beck’s alarm over the Fed’s hockey stick chart is justified.
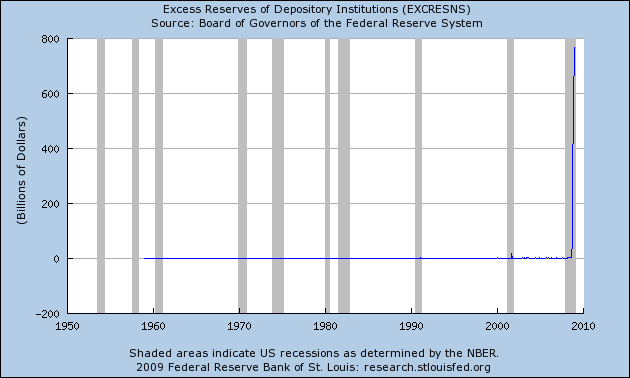
Nonetheless, let’s look deeper to see just what forces have led to the hockey stick effect of the monetary base chart. To do this, let’s review some of the basic Federal Reserve charts (see below) regarding our nation’s money supply. First you’ll see a chart of monetary base (M0) vs. year, which is identical to the chart Beck used, but with a shorter time span, 1980-2008 instead of 1918-2008. We’ll label this as M0 and include a brief definition of monetary base. It’s very important to note that the monetary base includes (1) the coins and currency in the hands of the public; and (2) bank deposits in the Federal Reserve system (emphasis added). It turns out that the hockey stick is primarily a result of unprecedented increases in bank deposits in the Federal Reserve system.
As can be seen by comparing the M0 chart with the next two charts of "Excess Reserves of Depository Institutions" (bank deposits in the Federal Reserve system in excess of the 10 percent reserve requirement) and "Total Borrowings of Depository Institutions from the Federal Reserve," the hockey stick effect in the M0 chart corresponds in shape and approximate dollar value to similar hockey sticks in the "Excess Reserves Deposits" and "Borrowings" charts. Regarding the unprecedented, rapid increases in "Excess Reserves Deposits" and "Borrowings," the former is at least partially explained by a policy shift last August by the Federal Reserve whereby it now pays interest to banks on their deposits in the Federal Reserve banks, and and the latter coincides with massive new loan programs for banks associated with the federal bailout programs of 2008-2009.
Furthermore, note that neither M1 nor M2 have declined during the last few months of 2008, so the rapid buildup of dollars in the monetary base has not occurred by simply transferring dollars from other parts of the economy. On the contrary, M1 has undergone its own rapid increase in late 2008.
Based on the above considerations, the "Monetary Base" chart is a kind of snapshot that reveals just how much money has been created by the Federal Reserve in recent months. As of now, this money remains largely in Federal Reserve banks as deposits by commercial banks. We won’t feel the inflationary effects of this new money until the commercial banks begin loaning it out and creating even larger increases in the money supply through the multiplying effects of fractional reserve banking.
Bottom line, Beck’s "monetary base" hockey stick chart reveals a huge (over $800 billion) and rapid buildup of our nation’s money supply during the closing months of 2008, which threatens us with future rapid losses in the buying power of the dollar.
The solution to these monetary problems of inflation is to restore sound money and phase out the Federal Reserve. The John Birch Society (JBS) has published a model "Sound Money and End the Fed" resolution for state legislatures to use for creating pressure on Congress to restore gold- and silver-based money and to phase out the Fed. The JBS has also posted a pre-written, editable email message for all Americans to use to directly influence their representative and senators in Congress to restore sound money and End the Fed.
M0 (Monetary Base): A measure of the money supply that includes only currency (banknotes and coins) held by the public and commercial banks’ deposits in the Federal Reserve.
Excess Reserves of Depository Institutions (in Federal Reserve banks): The Federal Reserve requires commercial banks to maintain reserve deposits in Federal Reserve banks of at least 10 percent of the value of the loans they make to their customers. Any bank deposits above the required reserve amounts are considered "excess reserves."
Total Borrowings of Depository Institutions from the Federal Reserve: This graph reveals how much money has been borrowed from the Federal Reserve by banks.
M1: A measure of the money supply that includes all coins, currency held by the public, traveler’s checks, checking account balances, NOW accounts, automatic transfer service accounts, and balances in credit unions.
M2: A measure of the money supply that includes M1, plus savings and small time deposits, overnight deposits at commercial banks, and non-institutional money market accounts.


