The Conference Board’s report on consumer confidence in September, released earlier this week, caught forecasters by surprise once again. Its Consumer Confidence Index, a barometer that measures the average American consumer’s confidence based on a monthly survey covering 5,000 households, jumped to 138.5 from August’s 134.7. Economists polled by Reuters expected a drop to 132. The baseline is 100, set back in 1985.
As Lynn Franco, director of economic indicators for the Board, noted:
After a considerable improvement in August, Consumer Confidence increased further in September and hovers at an 18-year high. The September reading is not far from the all-time high of 144.7 reached in 2000.
Consumers’ assessment of current conditions remains extremely favorable, bolstered by a strong economy and robust job growth. The Expectations Index surged in September, suggesting solid economic growth exceeding 3.0 percent for the remainder of the year.
These historically high confidence levels should continue to support healthy consumer spending, and should be welcome news for retailers as they begin gearing up for the holiday season.
Franco said consumers are not only presently optimistic just in time for Christmas, but their outlook over the next six months continues to be rosy as well:
Consumers’ optimism about the short-term outlook improved considerably in September. The percentage of consumers anticipating business conditions will improve over the next six months increased from 24.4 percent to 27.6 percent, while those expecting business conditions will worsen declined, from 9.9 percent to 8.0 percent.
Everywhere one looks, it seems, there is evidence of a robustly growing economy. The moderation in house price increases reported on Tuesday makes purchasing a new home a bit more affordable, especially for first-time buyers. Wage growth that exceeds price increases is encouraging those households not only to improve their standards of living but also to increase their savings rate, providing a cushion in the event of a downturn.
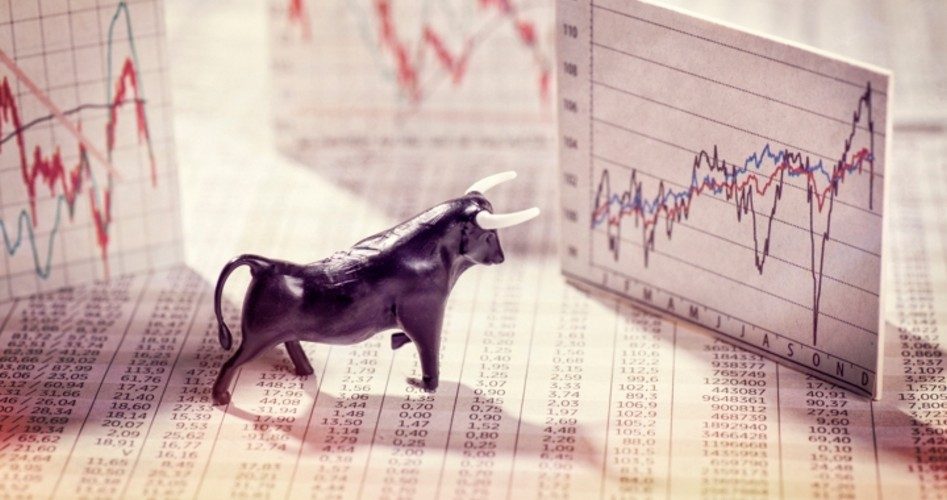
A downturn is what bears — those who believe that a market downturn is imminent — are watching for. But the evidence they find, so far, is scant. One bear, Albert Edwards, writing to his clients at Societe Generale, the French international banking and investment firm, said: “The U.S. consumer has gorged on optimism until they are fit to burst. This [report from the Conference Board] is as good a contrary indicator as [any].”
Another bear, David Rosenberg, chief economist for Gluskin Sheff, a Canadian investment management firm, said that euphoria marks the peak before a big decline. He noted that 43 percent of the households surveyed by the Conference Board were bullish, nearly double the 22 percent who were negative.
Neil Dutta, head of economics at Renaissance Macro, a technical analysis firm, took the data from the Conference Board and plotted its data starting in 1967 against the seven recessions that have occurred since then. He had hoped not only to find at what level the Consumer Confidence Index would shout “recession ahead” but the lead time as well. In economic forecasting that would be the Holy Grail.
Dutta found neither: “If there was a magic level, we would [see] recessions start around those points. Instead, recessions start at different levels of confidence.” So much for using the Conference Board reports to predict the future of the markets and the onset of the next recession.
Others use intuition, claiming that trees don’t grow to the sky and eventually — someday, some way, somehow — the stock market will drop, triggering a recession. John Hussman, president of Hussman Investment Trust and whom Business Insider has described as the “stock market’s biggest bear,” holds the “reversion to the mean” philosophy: Eventually there will be a top, then a sharp decline that overshoots to the downside, and then a rebound. Bears such as Hussman often refer to the stock market that topped out in September 2007 and then lost half its value before finding a bottom in February 2009.
Since then, of course, the market reversed course and now trades four times higher.
Little conversation focuses on the “elephant in the living room” — the $21 trillion national debt. At present, the interest costs on carrying that debt amount to something under $400 billion a year. But with interest rates being slowly ratcheted up by the Fed, costs of carrying that debt are estimated to approach $900 billion in a few years, more than the government spends on the military. And, despite the growth in the economy, government spending continues to grow even faster, setting in place a moment in time — no can say when, and few are even trying — when the government can no longer afford to service that debt. At that point, taxes will have to rise enormously, or the Treasury will be forced to borrow even more, or both, in order to pay the bills.
There’s another technical term for that moment in time: It’s called the start of a death spiral.
Image: gopixa via iStock / Getty Images Plus
An Ivy League graduate and former investment advisor, Bob is a regular contributor to The New American magazine and blogs frequently at LightFromTheRight.com, primarily on economics and politics. He can be reached at [email protected].


